fleet_health answers one question for a whole Kubernetes fleet: which clusters
are unhealthy right now? In
ocm-mcp-server it answers
that in a single call, and it runs in two phases:
- One paged list on the hub for every cluster's conditions.
- A concurrent scan of each spoke for unhealthy pods and degraded deployments, on a bounded worker pool.
The two phases degrade for different reasons. Phase one degrades when the hub
holds thousands of ManagedCluster objects. Phase two degrades when the spokes
are far away. A single end-to-end number averages a pagination test and a latency
test into something that describes neither, so
the benchmark
measures them separately, with different fixtures.
Phase one: hub-side pagination at 1,000 clusters
The fixture applies 1,000 fake ManagedCluster CRs to a real kind hub and
reads them back. Each figure is the min and median of five repetitions.
| scenario | best | median |
|---|---|---|
list_clusters @ 1,023 clusters |
0.079 s | 0.083 s |
fleet_health (hub only) @ 1,000 clusters |
0.083 s | 0.087 s |
A fleet two orders of magnitude larger than the project's kind test fleet reads
back in under a tenth of a second, because the list follows the apiserver's own
continue tokens rather than requesting the whole collection at once:
res = list_fn(*args, limit=LIST_PAGE_SIZE, **kwargs)
items.extend(res.get("items", []) or [])
cont = (res.get("metadata") or {}).get("continue") or ""
Pages are 500 items, with a 5,000-item ceiling. On hitting that ceiling the
response carries an explicit truncated note rather than returning a short list
that reads as complete. That marker matters more than the latency does: an agent
handed 5,000 of 7,000 clusters with no warning will produce a confident report
about a fleet with 2,000 machines missing from it.
Scale caveat, stated where the number is: these are 1,000 custom resources, not 1,000 clusters. There is no apiserver behind them and no klusterlet. This measures hub-side API storage and pagination, and nothing else. "A 1,000-cluster benchmark" is the more impressive phrase and the wrong one.
Phase two: fan-out across 20 real apiservers
Fan-out needs real apiservers answering real list calls, and 1,000 apiservers do
not fit on a laptop. The fixture uses kwok to run
20 independent kube-apiservers, each with a fake node and roughly 50 pods
that kwok's controller drives straight to Running. Each is registered as a
ManagedCluster on the hub and wired into the server's spoke contexts, so the
scan performs a genuine pod and deployment list against a genuine apiserver.
| scenario | best | median |
|---|---|---|
sequential (workers=1) @ 20 spokes |
0.356 s | 0.367 s |
concurrent (workers=8) @ 20 spokes |
0.299 s | 0.302 s |
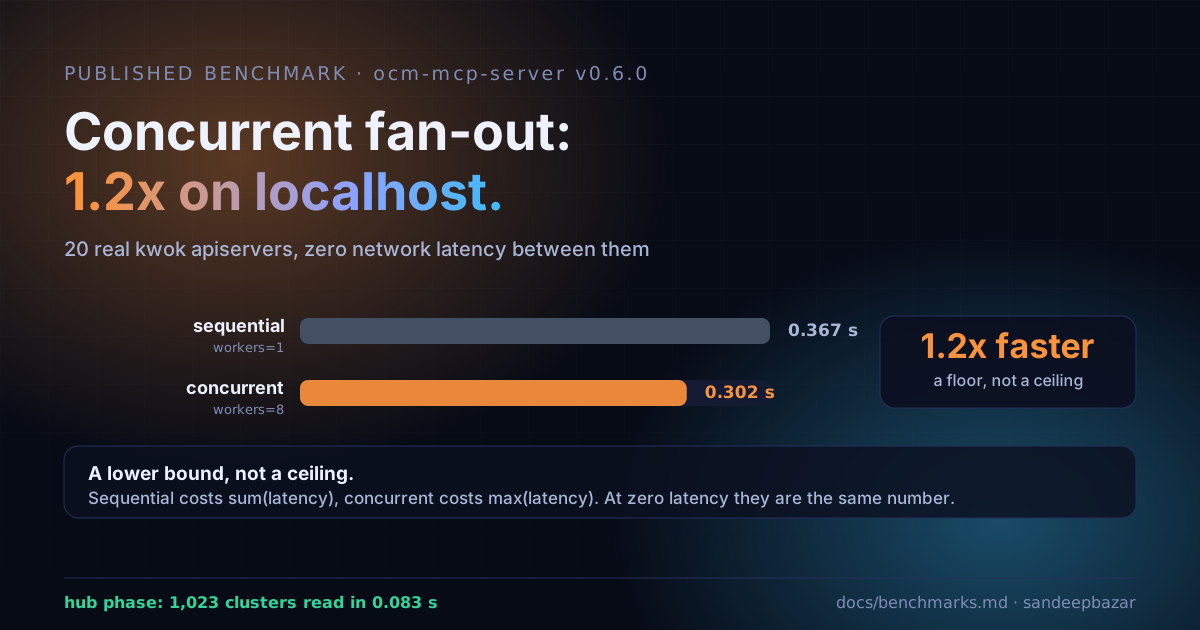
Eight workers across twenty spokes buys 65 milliseconds. 1.2x.
The latency arithmetic
All twenty kwok apiservers run as local processes on one machine, so per-spoke round-trip latency is near zero. That single property determines the result.
- Scanning spokes one at a time costs the sum of their latencies.
- Scanning them concurrently costs closer to the largest single latency.
When every latency is near zero, the sum and the largest converge. There is nothing left for concurrency to win, and what the 1.2x actually measures is thread-pool overhead against local process scheduling.
Distribute those spokes across regions, where each call pays tens to hundreds of
milliseconds, and the two quantities separate. With at least as many spokes as
workers at comparable latency, the expected speedup approaches the worker count:
8x at the default OCM_MCP_FANOUT_WORKERS=8, not 1.2x.
So 1.2x is a lower bound, produced under the friendliest possible conditions for the sequential path it is measured against. The benchmark cannot reach the regime the thread pool exists for, and a single machine cannot host that regime.
Three ways to write that down, only one of which survives a re-run:
| Claim | Problem |
|---|---|
| "Up to 8x faster" | A projection presented as a measurement. |
| Drop the fan-out | Removes what matters on a real fleet because a localhost test cannot see it. |
| "1.2x, and here is why it is a floor" | Reproducible, and states which direction the error points. |
Benchmarking a two-phase read path
Three rules generalize past this codebase:
Measure each failure mode with its own fixture. A read path that paginates and fans out has two independent scaling limits. One combined number hides both, and hides which one a given fleet will hit first.
Put the simulation in the same sentence as the result. "1,000 clusters" and "CRs only, no apiserver" belong together. The gap between them is exactly where a reader fills in something better than what was measured.
State the direction of the error. "This is a lower bound" is more actionable than a confidence interval nobody computed. A reader who knows the number can only rise with real latency can reason about their own topology; a bare 1.2x tells them to skip the feature.
Run it
git clone https://github.com/ocm-mcp-server/ocm-mcp-server
cd ocm-mcp-server
bash hack/bootstrap.sh                              # kind hub + 3 spokes

OCM_MCP_HUB_CONTEXT=kind-hub python3 hack/bench_fleet.py --phase hub
OCM_MCP_HUB_CONTEXT=kind-hub python3 hack/bench_fleet.py --phase fanout
The script removes its 1,000 fake CRs and its kwok clusters afterwards and leaves
the kind fleet untouched. --keep skips teardown.
A run against spokes in more than one region measures the regime a single machine
cannot. Full method, versions and caveats:
docs/benchmarks.md.